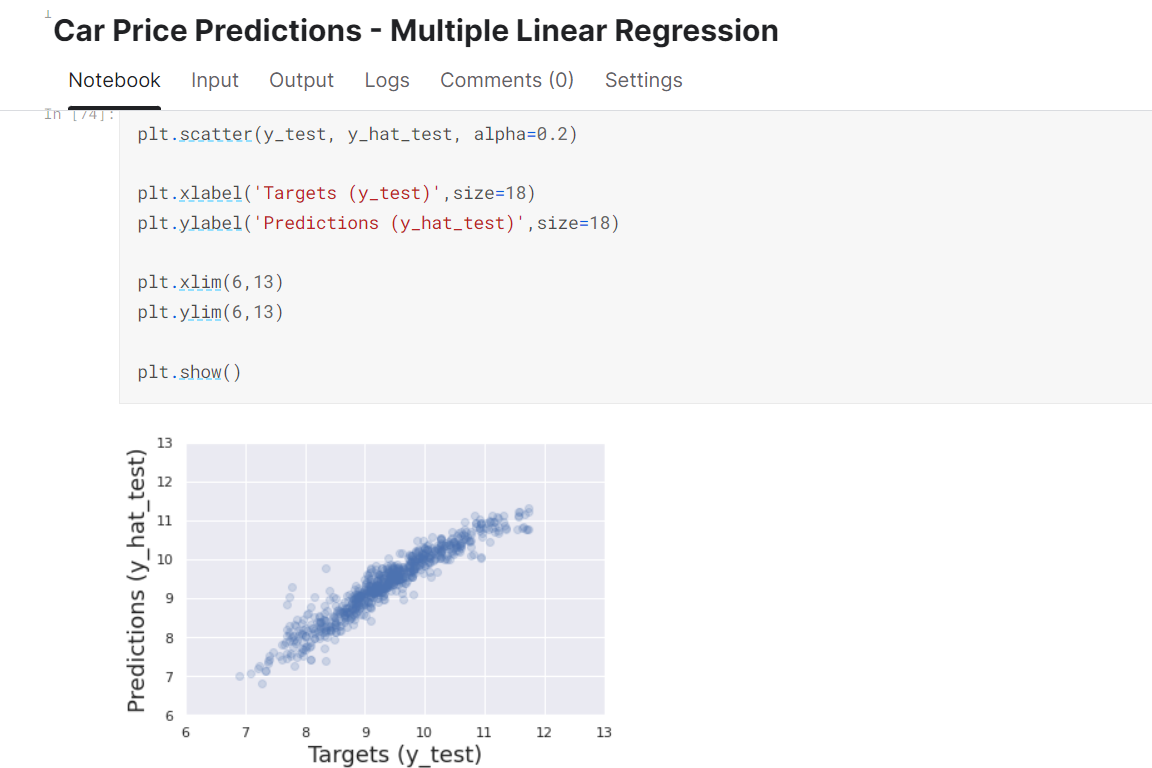
Car Price Prediction Using Multiple Linear Regression in Python
In this project, I created a machine learning model that takes several features of cars and predicts the accurate price using supervised learning technique.

Hello and welcome to my website that I created to showcase my portfolio.
My name is Tomas Kejha and I am from the Czech Republic. I am holding a Bachelor's degree in Economics and Management and later
graduated in
Global Human Resource Management from National Sun Yat-sen University in Taiwan with MBA.
During my studies, I became interested in the field of data analytics.
I completed the Google Data Analytics Certificate to learn the necessary skills in software such as Python, SQL, PowerBI, Tableau, Excel and R. I also
discovered the tremendous power that data
can bring to any field and business. For that reason, I completed the Data Scientist Career Track Certification to be able to harness the power of
data and bring valuable insights.
I enjoy the most working in Python's Jupyter Lab which allows me to perform the majority of the data science processes
in one environment, such as data loading, manipulation, cleaning, EDA and finally machine learning.
Please click the button below to find more details in my resume.
In this project, I created a machine learning model that takes several features of cars and predicts the accurate price using supervised learning technique.
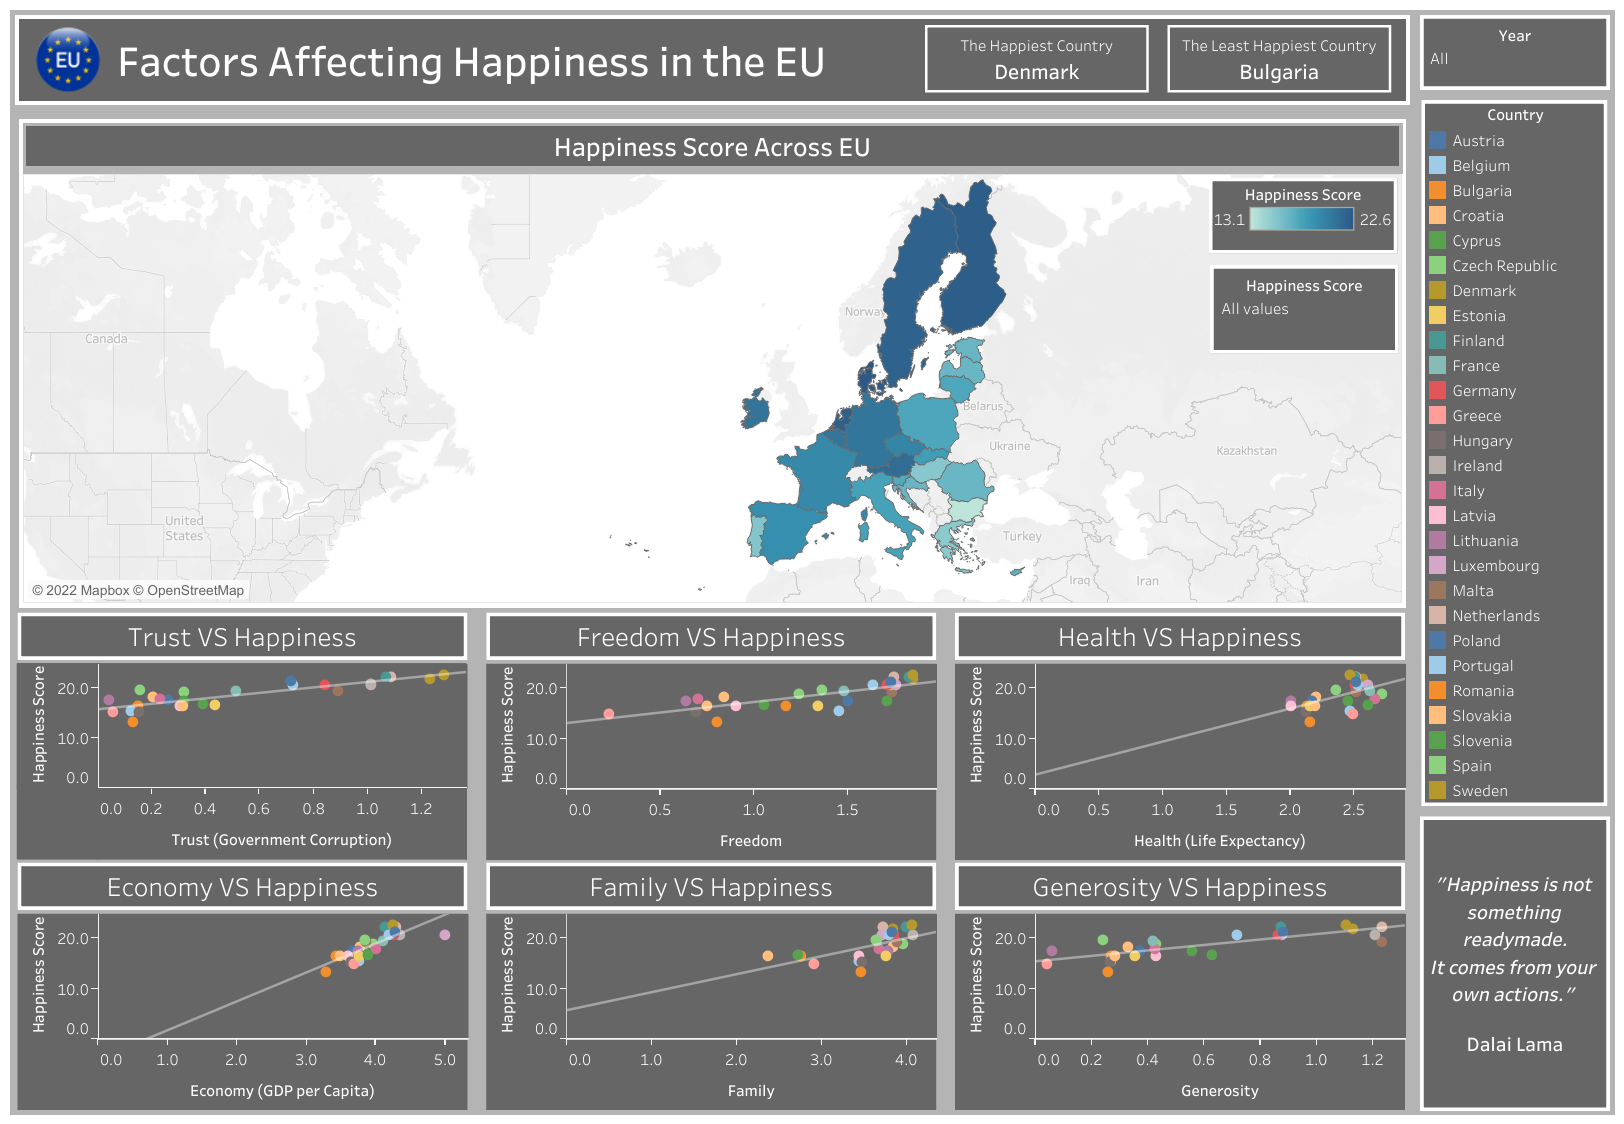
This interactive dashboard created in Tableau shows happiness scores across countries that are members of the European Union. Several factors were chosen to demonstrate how they affect perceived happiness in the EU countries.
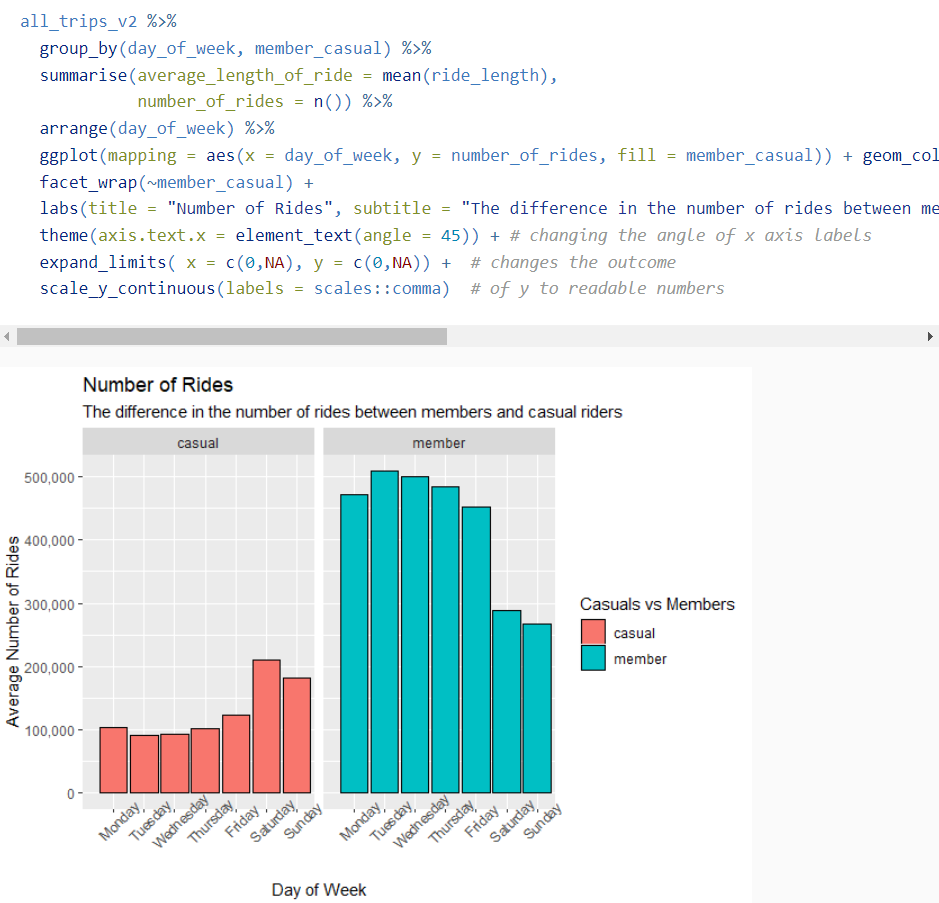
This RMarkdown file showcases the process of cleaning and analyzing data in R. The project is based on a case study given by the Google Data Analytics Certificate.
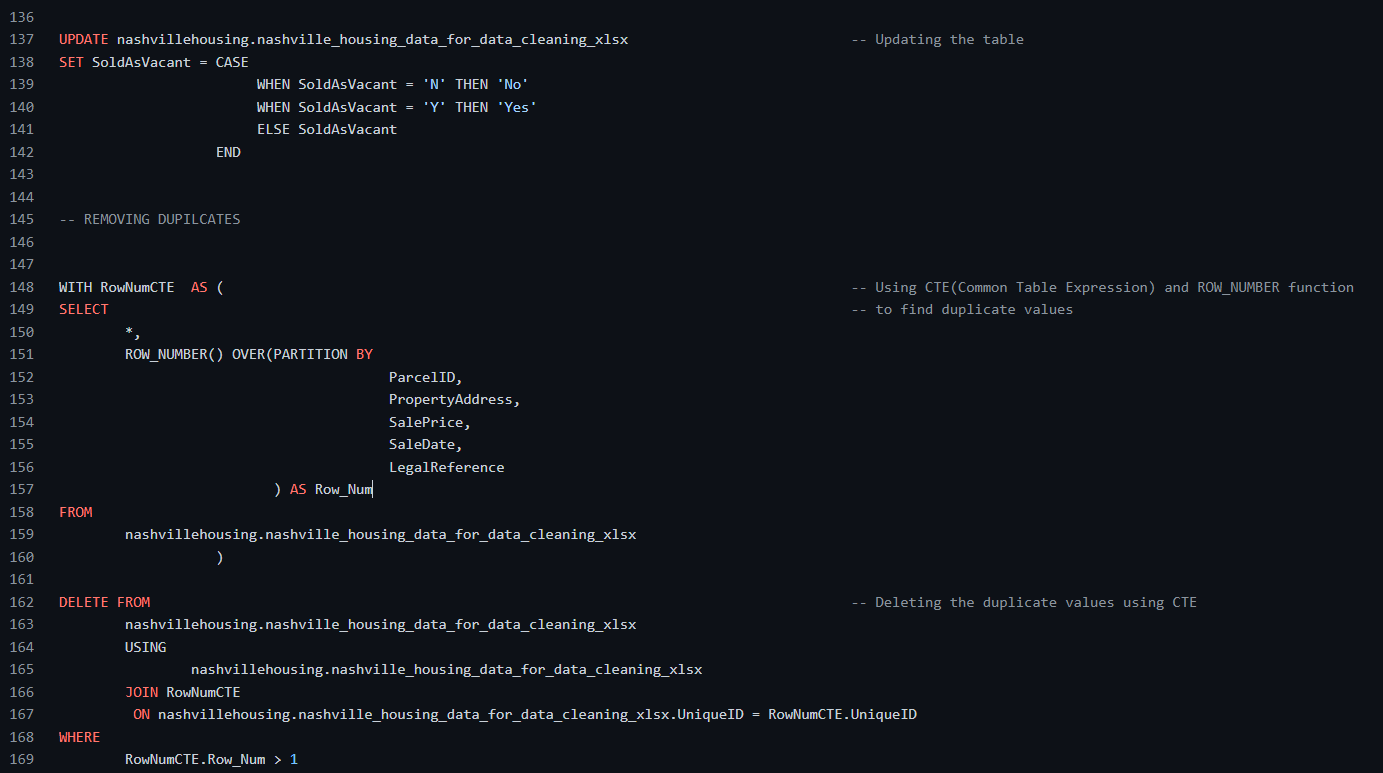
This project demonstrates data cleaning in DBeaver using MySQL. Dataset includes data about housing in Nashville. Details are included in the beginning of the SQL file.
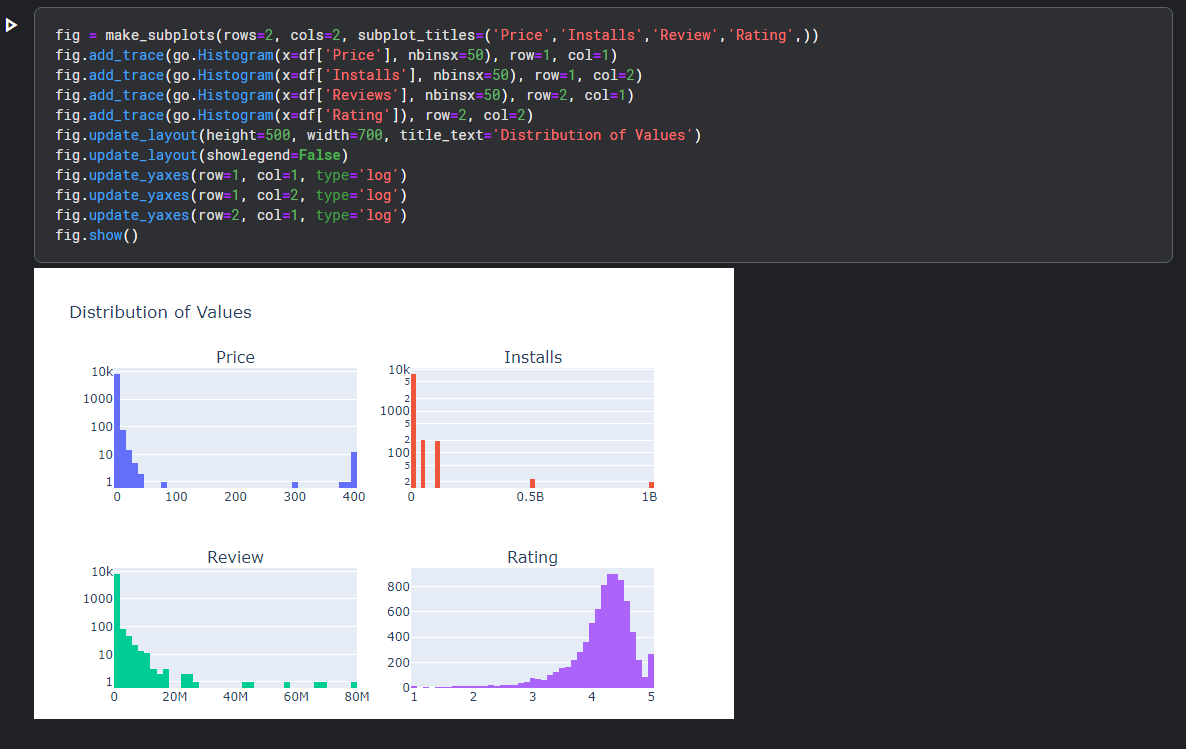
I used a dataset available on Kaggle concerning Google Play Store Apps. After cleaning and preprocessing the data, I conducted an exploratory data analysis to find out the most popular apps and what do they have in common. I also explored the whole dataset to gain a better understanding of the Google apps market.
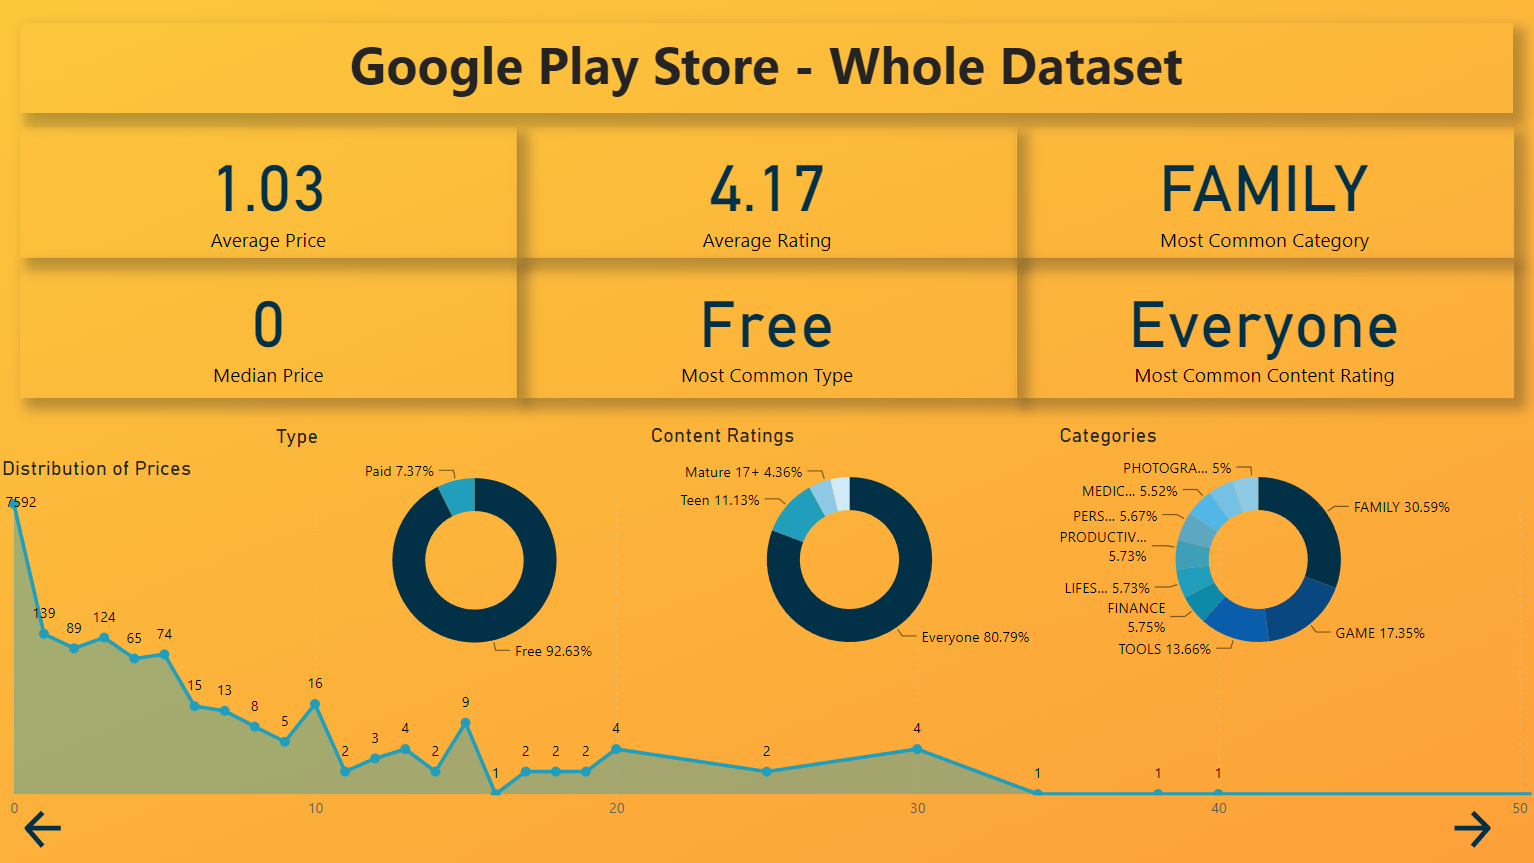
This project follows the cleaning and analysis of Google Play Store Apps data. After performing the exploratory analysis, I used PowerBI to showcase the main points from the top 10 most popular apps and the whole dataset. The last page of the dashboard also includes key findings which communicate more detailed observations .
You can use the icons located on the left side of the page to view my social sites. If you have any inquiries, please do not hesitate to contact me. I will be looking forward to hearing from you.